1 million euros per day: Why product complexity causes more than just opportunity costs
Recently, Airbus announced delays in some aircraft deliveries scheduled for 2024. Simultaneously, Boeing faces production hurdles, preventing the company from increasing its output. These are just two setbacks that underscore the critical need for OEMs across many industries for enhanced efficiency and innovation in complex systems development. The intricacies of mechatronic systems e.g. planes, cars, trucks, trains etc. are growing exponentially – while the challenges faced by industry giants highlight a universal truth: without a unified approach to manage complexity, even the most established organizations can falter.
Modern mechatronic systems integrate mechanical components, electrical systems, and software, each with its own requirements and dependencies. This kind of complexity increases exponentially as the need for seamless integration grows, making it harder to manage interdependencies, track system maturity, and prevent issues from escalating.
From the perspective of CTOs or Series Lead Managers, this complexity poses significant challenges. Both have to oversee the development of innovative vehicles that meet market demands while ensuring efficiency and cost-effectiveness.
Without a unified approach, their R&D engineers struggle to keep track of critical dependencies between subsystems. The result is a reactive mode of operation, where teams spend more time in taskforce mode than driving innovation. For R&D executives and CTO staff, this creates constant bottlenecks, slowing down development cycles. Every single day of delayed SOP (start of production) can mount up to 1 million euros increase in budget, directly impacting the company's competitive edge.
Automotive R&D: Increasing complexity meets siloed engineering
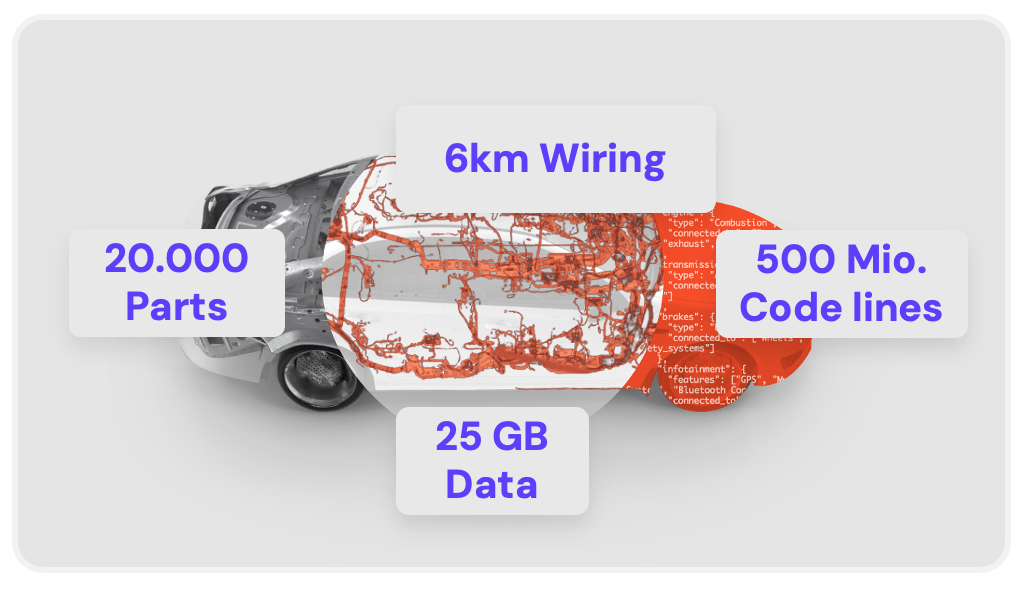
In the automotive industry, the challenges of mechatronic systems are magnified. Modern vehicles are no longer just mechanical machines; they are highly complex systems of integrated electronics, embedded software, and connectivity. Modern vehicles contain more than 500 lines of code and about 25 gigabyte of data. From advanced driver assistance systems (ADAS) to electric powertrains in EVs, each innovation adds new layers of complexity. That makes it almost unmanageable for a single human mind.
However, the tools traditionally used by managers in Automotive R&D, such as spreadsheets, email threads, and disconnected project management systems are simply not equipped to handle this level of complexity. These tools often create data silos, leaving teams and managers alike with an incomplete picture of the project.
From firefighting to innovation: Eliminating taskforce mode with data transparency
For R&D executives, the result of these challenges is a persistent need for taskforce-driven problem-solving. When issues arise, teams are forced to reactively assemble taskforces to diagnose and fix problems that could have been prevented with better visibility and coordination. This firefighting approach takes away valuable time from innovation and shifts the focus to administrative tasks, error correction, and crisis management.
Without a single source of truth, decision-making is often based on assumptions rather than facts. In an industry where time-to-market is critical, this reactive mode of operation blocks innovation and puts projects at risk of falling behind.
What if there was a better way?
What if taskforce mode could be eliminated and teams got access to real-time visibility into all aspects of the development process? What if data was no longer siloed, and engineers, managers, and integration specialists always had access to the same up-to-date information? What if teams could manage dependencies, predict issues before they arise, and make informed decisions based on real-time data?

Boosting R&D efficiency in Automotive with data-driven decision-making
With the increasing development complexity of vehicle systems and software architectures, tighter timelines, and more product variants, CTO staff and lead managers of any OEMs need comprehensive oversight of all available data to manage the entire development process.
Such a centralized approach prevents issues from escalating, enabling proactive decision-making rather than reactive problem-solving. Development teams could now focus on driving innovation and improving vehicle performance, all while reducing admin overhead.
SPREAD’s Action Tower eliminates these challenges by offering exactly that. It’s a centralized solution that provides:
- Up-to-date, data-driven insights
- 100% data transparency
- Focus on innovation instead of firefighting
The impact of SPREAD’s Action Tower on R&D efficiency
The Action Tower provides much-needed transparency, allowing CTO staff and R&D executives to focus on strategic innovation instead of daily firefighting. The result? A massive reduction in admin overhead, fewer taskforces, and more time spent on product development and innovation.
With the Action Tower, engineering teams can achieve:
- 1-2 year reduction in time-to-market
- 40% improvement in resource allocation
- 60% reduction in rework
- More focus on innovation
Extend Action Tower efficiency to Production and Aftermarket
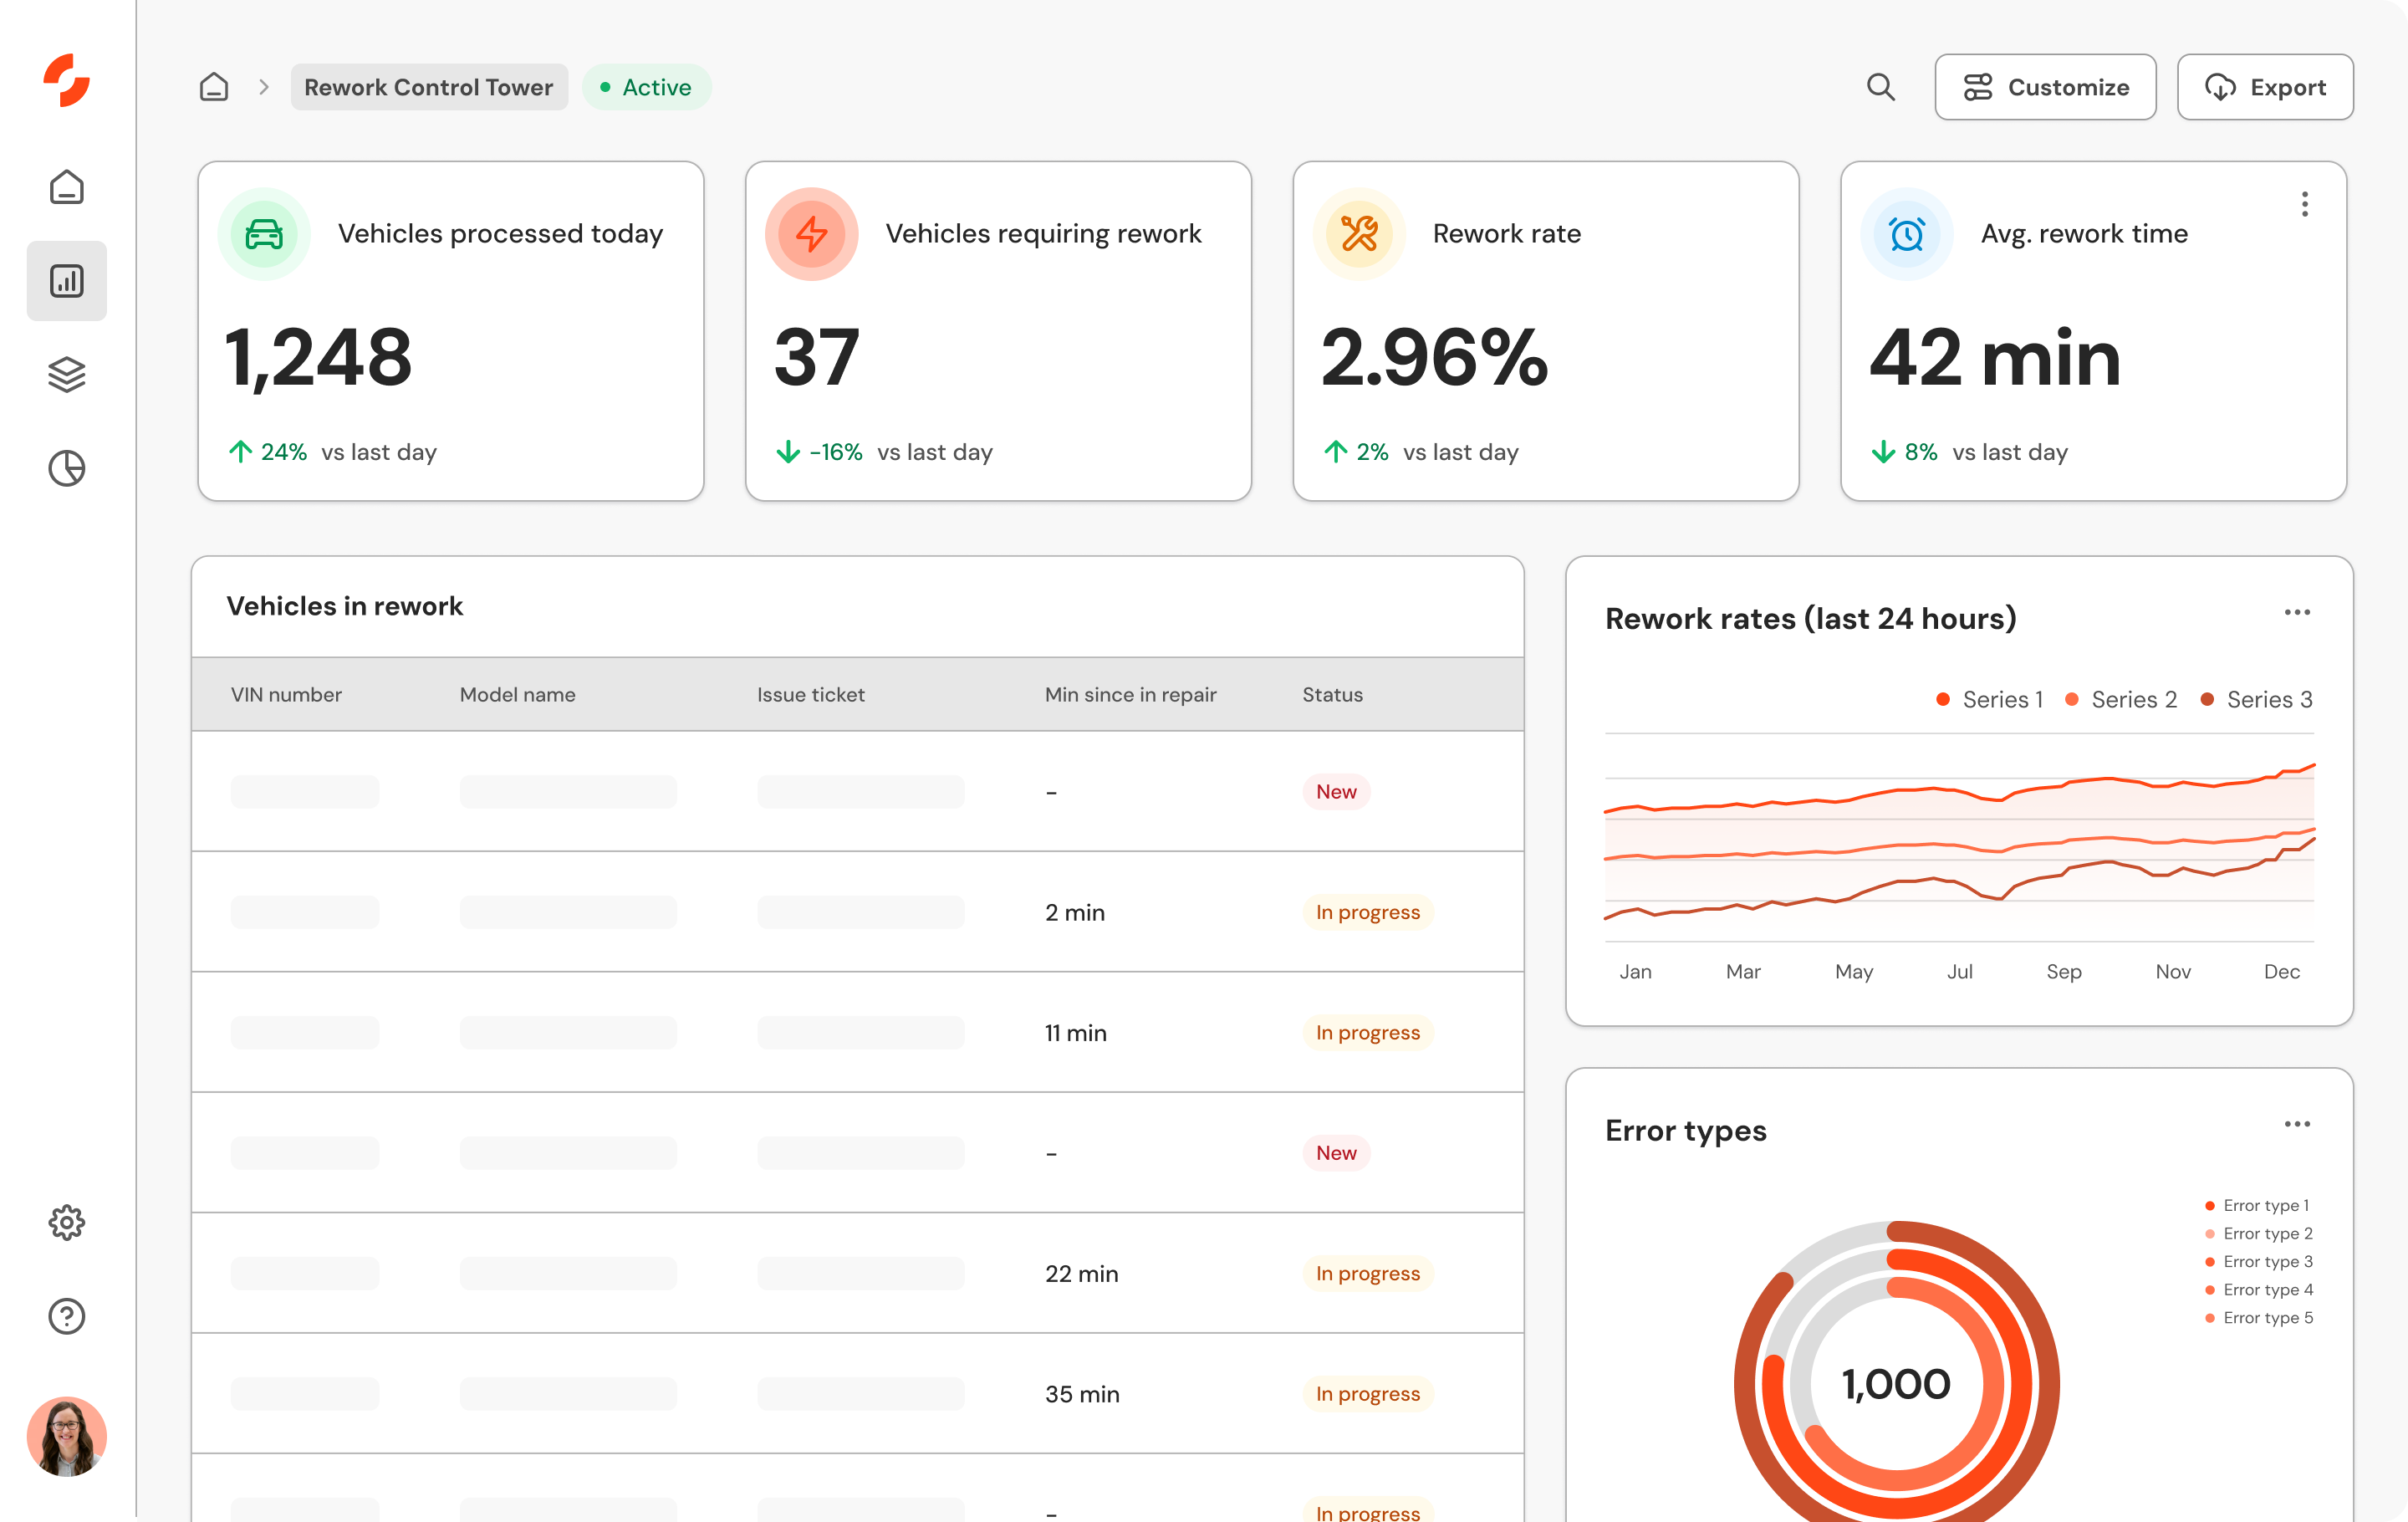
What SPREAD’s Action Tower achieves in R&D can be seamlessly extended to Production and Aftermarket. By providing real-time visibility into production processes, rework levels, and root causes, the Action Tower improves operational efficiency across the board.
- In Production, the Action Tower identifies bottlenecks, reduces downtime, and boosts first-pass yield by 30%.
- In Aftermarket, it speeds up issue resolution by 70%, cuts warranty costs by 50%, and boosts customer satisfaction by 20%.
Whether it’s managing Production or Aftermarket operations, SPREAD Action Tower enables better decision-making, faster issue resolution, and reduced operational costs.
How Action Tower works: Tailored dashboards for every role
The Action Tower offers customizable dashboards designed to fit the specific needs of each role, whether it’s functionality leads, R&D executives, or integration engineers. These dashboards deliver real-time, actionable data tailored to each team’s unique workflow, ensuring that every stakeholder has access to the right data at the right time. Here is an overview of what Action Tower has to offer:
Project Management Dashboard
The Project Management Dashboard is a powerful tool that keeps lead managers and R&D executives fully informed about all aspects of project development. It consolidates essential project data into a single, intuitive interface, enabling seamless oversight without the need for constant taskforce interventions.
Key features:
- Timelines and milestones: Visualize project timelines with Gantt charts, track milestones, and monitor progress against deadlines. This feature ensures that projects stay on schedule and helps identify any delays early on.
- Risk management: Identify potential risks and their impact on the project. The dashboard provides real-time alerts for emerging issues, allowing managers to implement mitigation strategies promptly.
- Dependency tracking: Understand and manage dependencies between different subsystems and teams. This visibility helps in coordinating tasks and preventing bottlenecks that could hinder progress.
- Resource allocation: Monitor resource utilization across teams. Allocate or reallocate resources efficiently based on workload, priorities, and project needs.
- Budget monitoring: Keep track of project budgets, expenditures, and forecasts. This financial oversight helps prevent cost overruns and ensures efficient use of funds.
- Collaboration tools: Integrated communication channels enable team members to share updates, documents, and feedback directly within the dashboard.
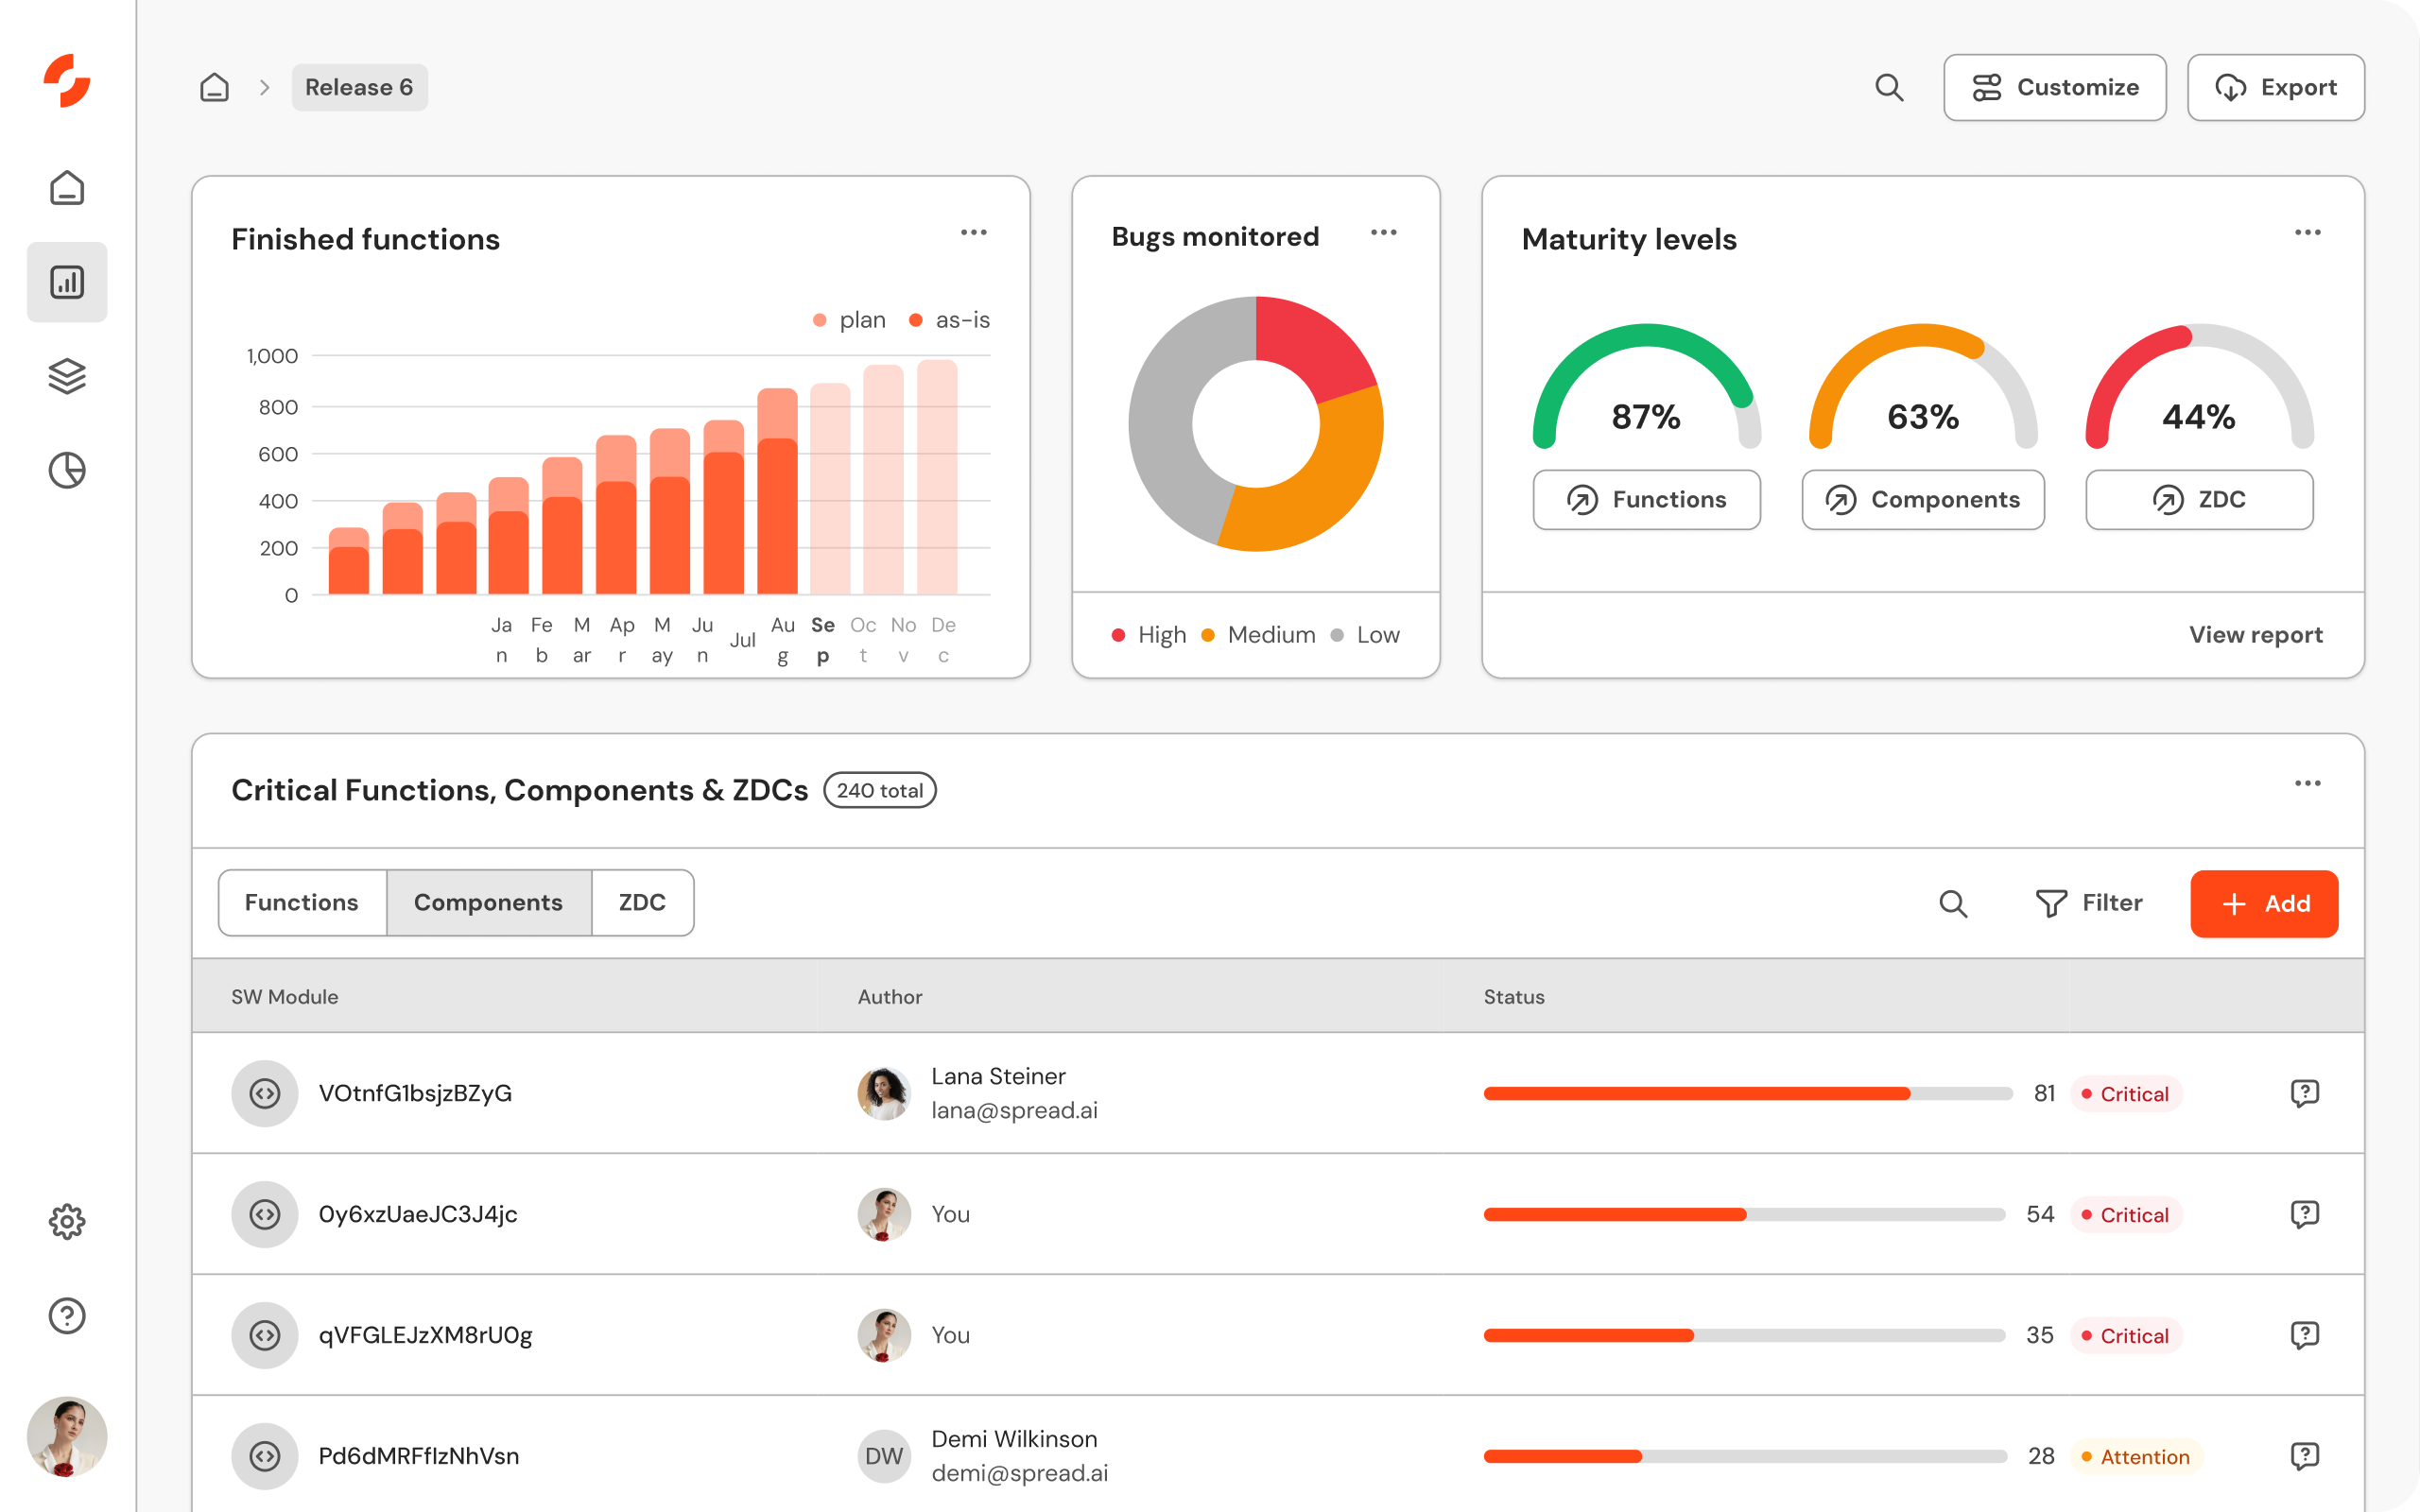
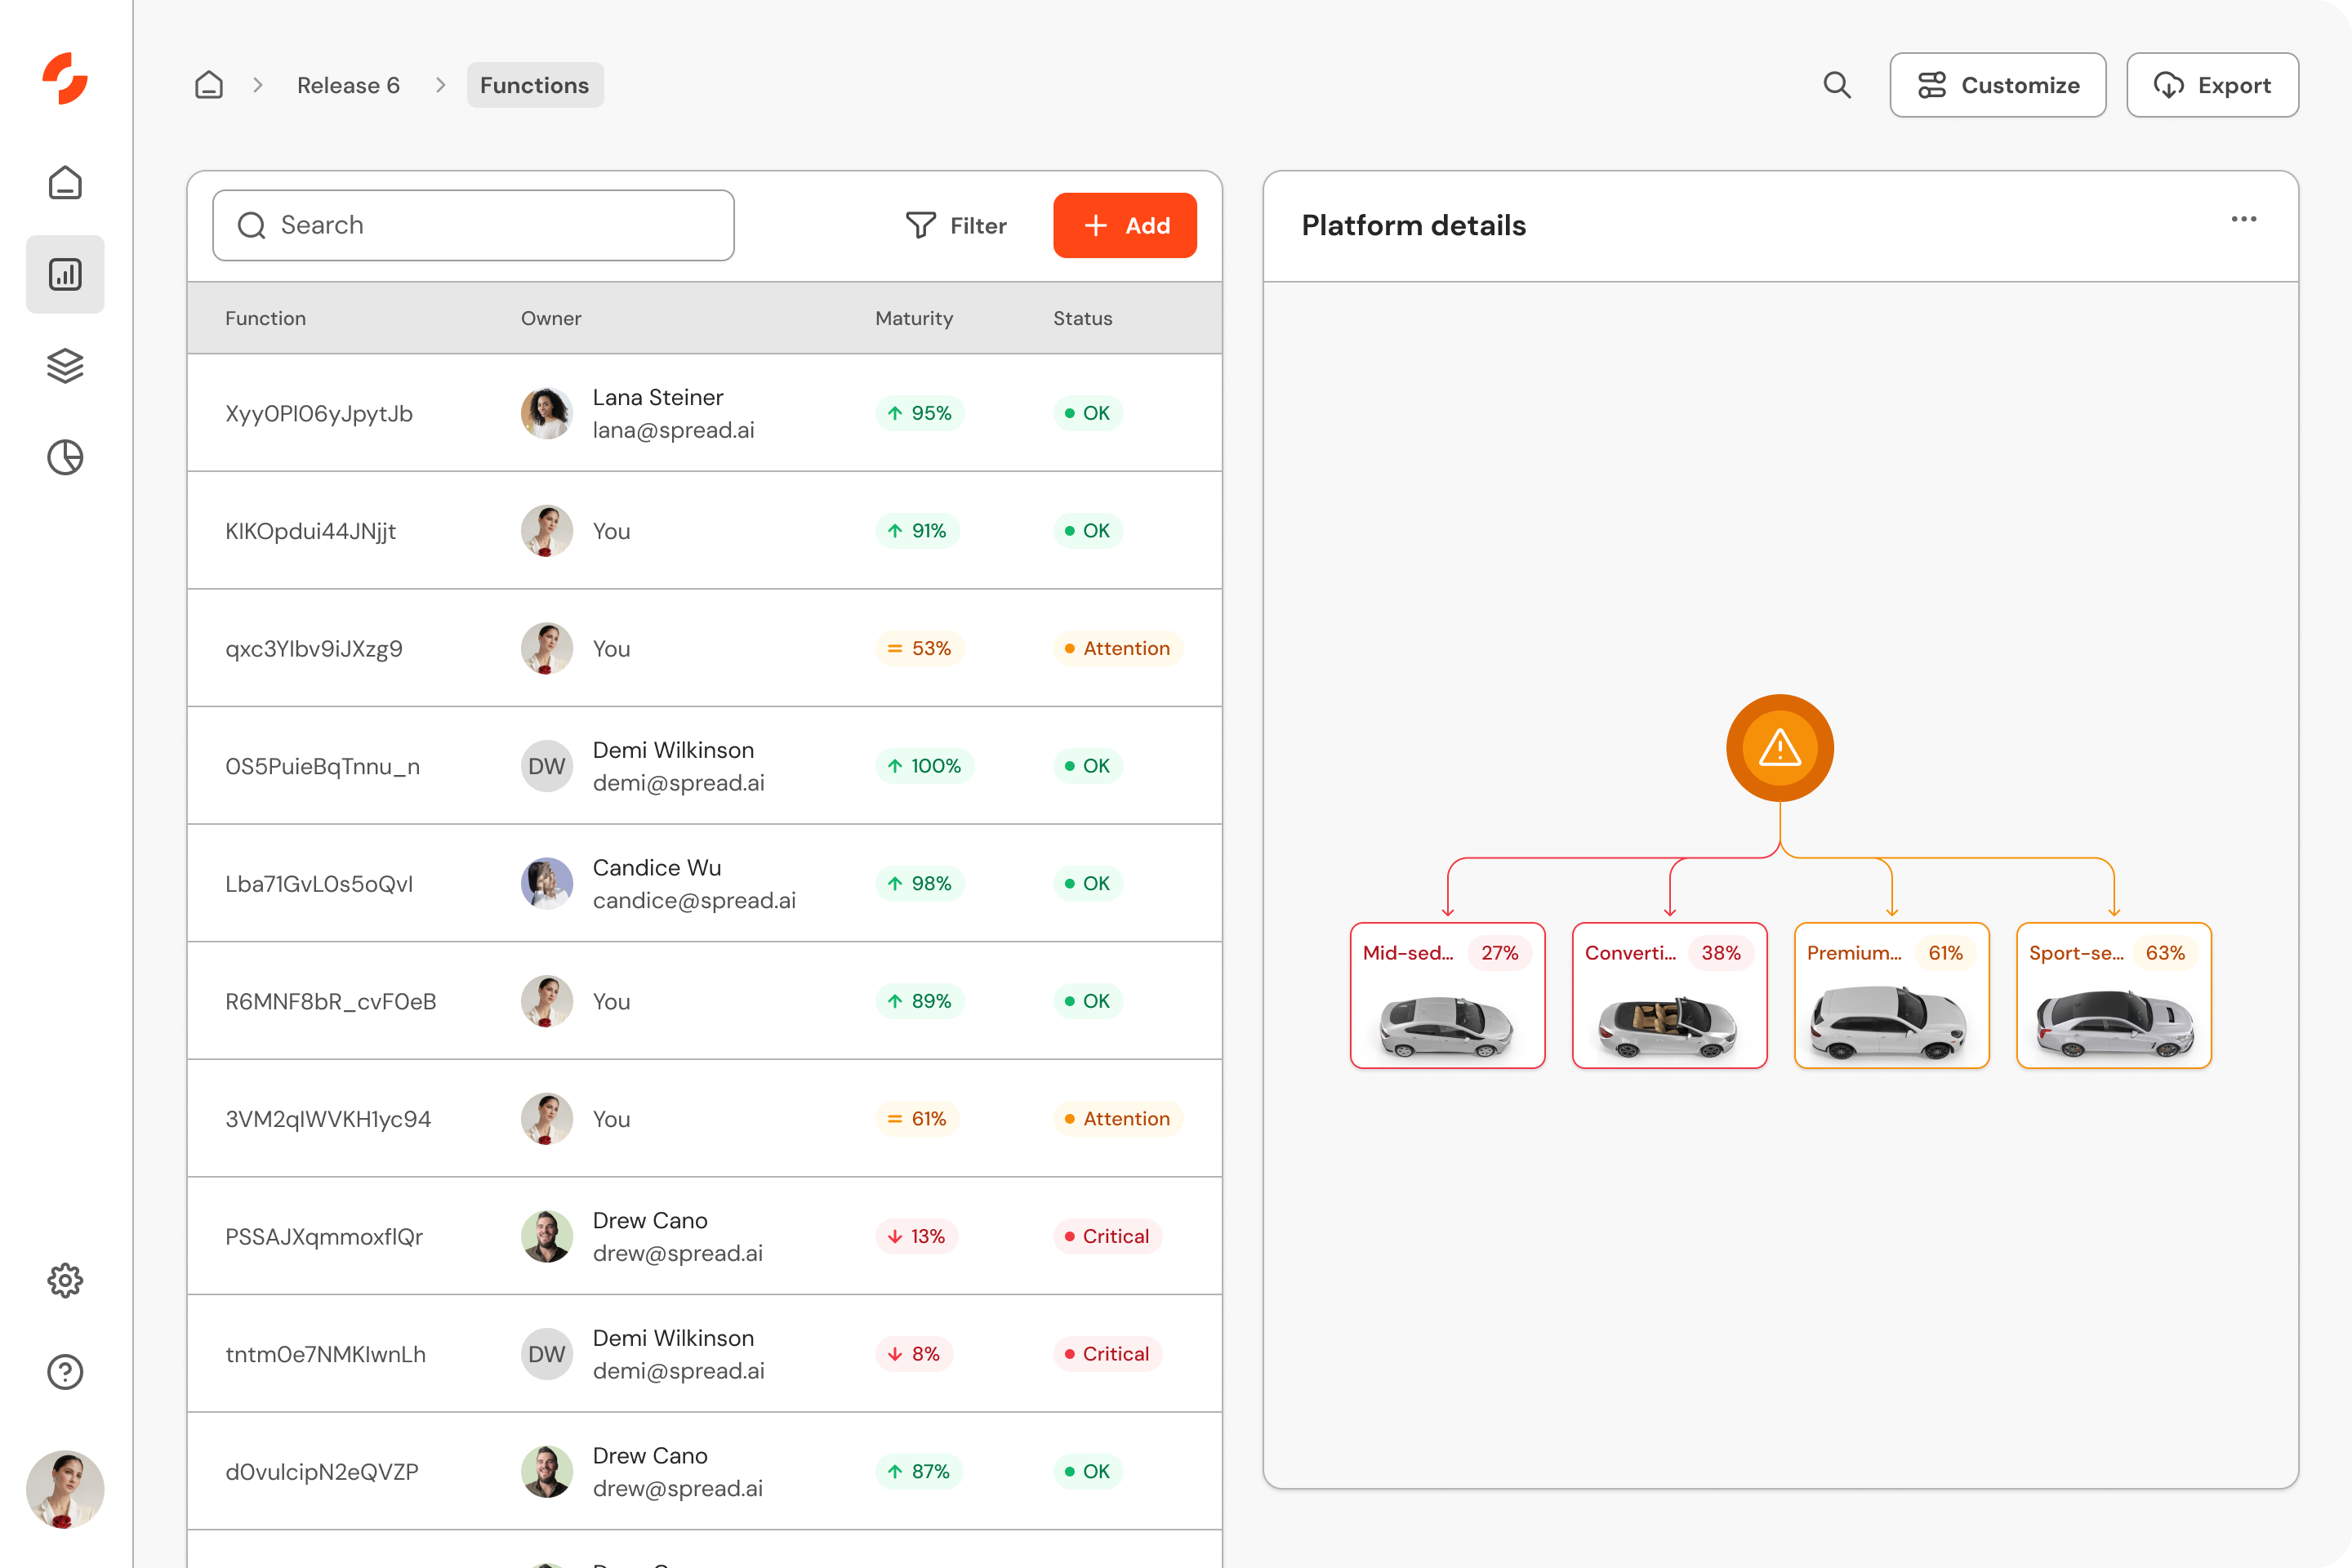
Error Management & Maturity Dashboard
Designed for functionality leads and their development teams, the Error Management & Maturity Dashboard focuses on tracking and resolving errors throughout the development lifecycle. It ensures that deliveries stay on schedule while minimizing rework.
Key features:
- Up-to-date error tracking: Automatically detect and log errors across all systems and components. The dashboard provides detailed error reports, including severity levels and affected modules.
- Maturity metrics: Assess the readiness level of different subsystems. Visual indicators show the maturity of each component, helping teams focus on areas that require attention.
- Prioritization: Categorize errors based on impact and urgency. This feature helps teams address the most critical issues first, optimizing resource utilization.
- Trend analysis: Monitor error trends over time to identify recurring problems or patterns. This insight aids in implementing long-term solutions rather than temporary fixes.
- Integration with development tools: Seamlessly connect with existing issue trackers and version control systems for a unified workflow.
- Automated notifications: Set up alerts for new errors or changes in error status to keep the team informed instantly.
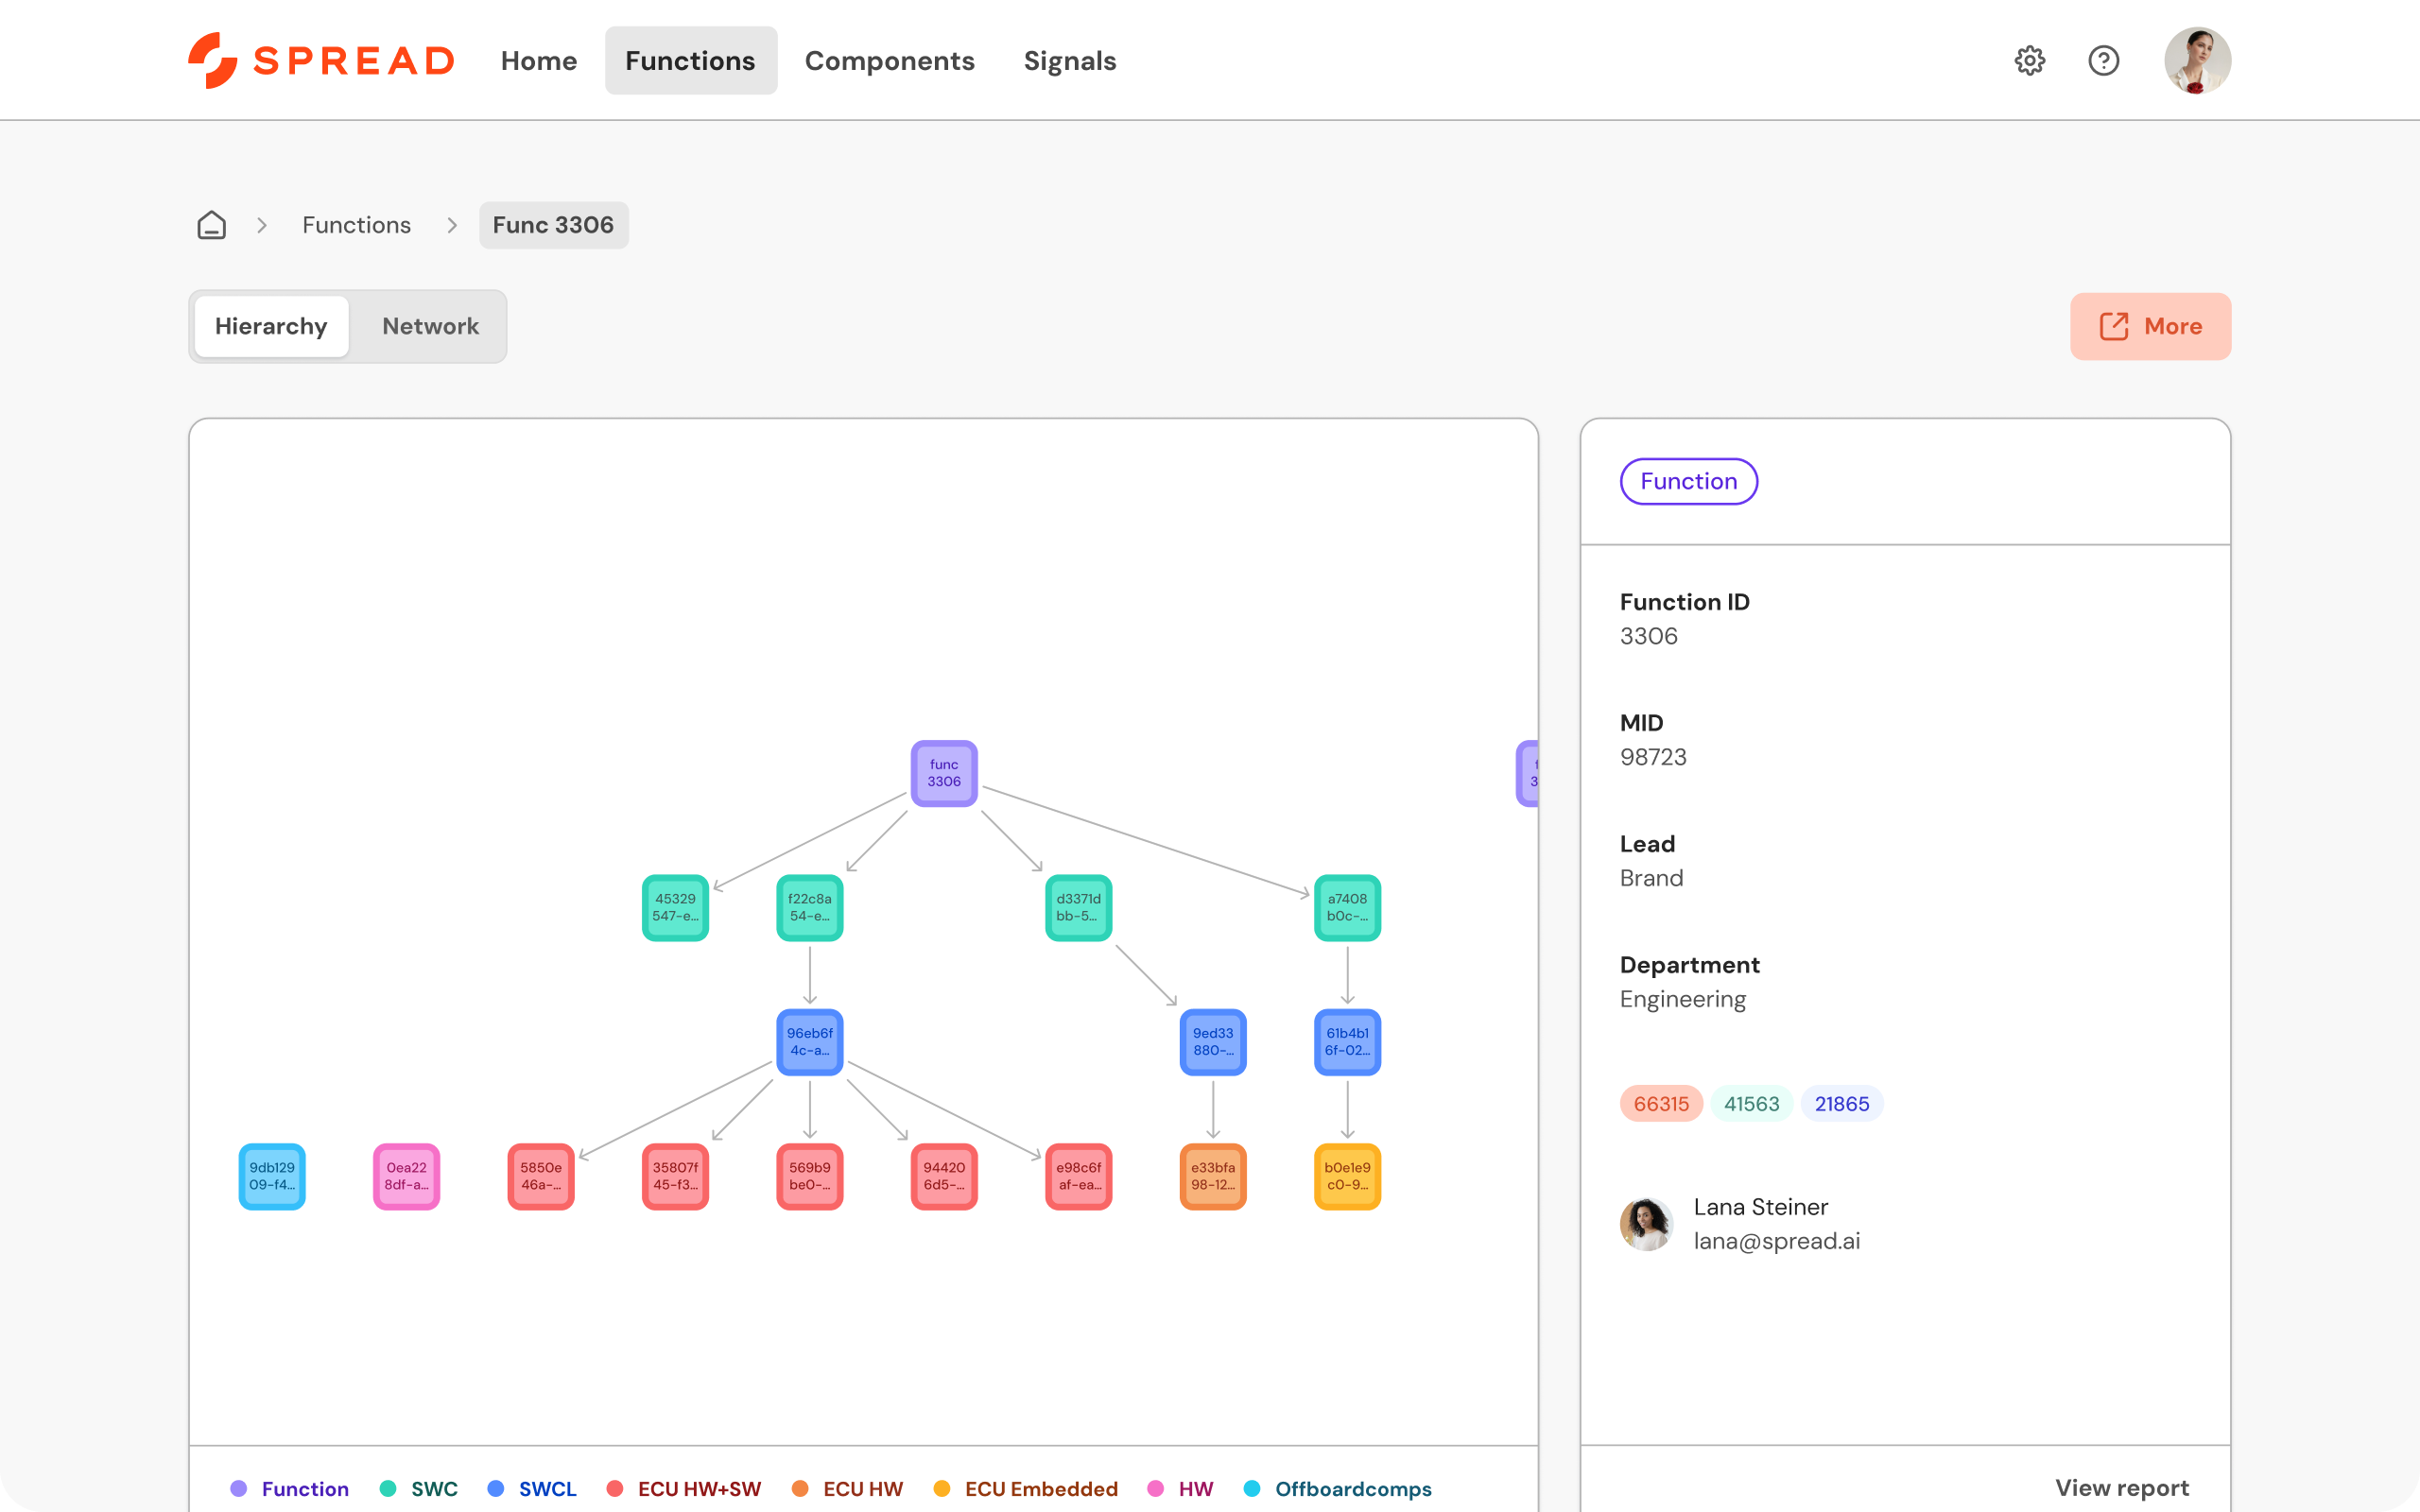
System Architecture Dashboard
The System Architecture Dashboard is an essential tool for system architects and engineers. It provides a comprehensive view of the system's structural design, enabling teams to visualize dependencies and optimize performance from the design phase onward.
Key features:
- Dependency visualization: Graphical representations of system components and their interconnections help architects understand complex relationships and identify potential points of failure.
- Performance monitoring: Real-time metrics on system performance, including processing speeds, load capacities, and response times.
- Configuration management: Keep track of different system configurations and their impact on performance and compatibility.
- Impact analysis: Simulate how changes to one component affect the rest of the system. This predictive capability aids in making informed design decisions.
- Compliance checks: Ensure that the system architecture adheres to industry standards and regulatory requirements by automatically validating design elements.
- Collaboration features: Share architectural diagrams and notes with team members for collaborative planning and problem-solving.
Integration & Testing Dashboard
The Integration & Testing Dashboard empowers integration engineers and testing teams to streamline the testing process, manage scope changes effectively, and boost overall productivity. It centralizes all testing activities and provides insights necessary for timely and efficient integration.
Key features:
- Test management: Organize and schedule tests, manage test cases, and track test execution status in real-time.
- Automated testing integration: Connect with automated testing tools to execute tests and collect results without manual intervention.
- Release management: Oversee software releases, including version control, release notes, and deployment schedules.
- Scope change tracking: Monitor changes in project scope, requirements, or specifications, and assess their impact on testing and integration efforts.
- Defect tracking: Log and manage defects discovered during testing. Assign issues to team members and monitor their resolution status.
- Reporting & analytics: Generate detailed reports on testing progress, pass/fail rates, and quality metrics to inform stakeholders.
Action Tower: Powered by SPREAD's Product Twin
SPREAD's Product Twin (PT) provides a centralized source of truth that connects and unifies data from PLM, ERP, and custom databases into a single, intuitive interface. At the heart of the PT is the Knowledge Graph technology, a powerful tool for visualizing and managing complex systems by representing entities (nodes) and their relationships (edges).
Beyond centralizing data, the PT leverages a Product DNA digital twin that captures, connects, and analyzes comprehensive information related to a physical product within an extensive parametric model known as the Engineering Intelligence Graph. This advanced system delivers complete, up-to-date product intelligence that combines structured and unstructured data, enabling engineers to address complex challenges effectively.
In R&D and production environments, this technology is particularly useful for understanding intricate connections between components - such as a vehicle's wiring harness and its links to various systems. Unlike traditional databases, graph databases excel at managing and querying these complex relationships, making it easier to track and optimize data flows and interactions.
For production executives and engineers, this translates to faster troubleshooting, better visibility into system dependencies, and more efficient management of complex mechatronic systems.
Key capabilities of SPREAD’s Product Twin:
Intelligent Data Integration
SPREAD's PT ensures seamless integration of data from various systems, such as Product Lifecycle Management (PLM), Enterprise Resource Planning (ERP), and custom databases. Through its Data Ingestion & Mapping layer, it brings together structured and unstructured data across domains, transforming disconnected datasets into a cohesive, accessible intelligence layer.
This intelligent integration minimizes data silos, enabling teams to see a unified view of product-related information in real-time. The result is a comprehensive data foundation that supports accurate, data-driven decisions and minimizes the chances of overlooked dependencies or blind spots during complex change processes.
App-based analysis & workflows
With SPREAD’s low-code/no-code platform, engineering teams can create custom applications to analyze data and manage workflows effortlessly. These applications are purpose-built to handle product engineering tasks, from impact analysis to real-time monitoring.
This app-based approach ensures engineers can adapt workflows to project needs rapidly, optimizing productivity and enabling precise analysis without extensive technical configuration. The platform supports intuitive app-building with pre-built templates, making it easy to adapt the solution to changing requirements or new insights.
Cross-domain change management
SPREAD’s PT connects data across multiple engineering domains, providing a cross-functional view essential for managing change effectively. By leveraging its Engineering Intelligence Graph, the system enables end-to-end traceability, mapping out the impact of changes across R&D, Production, and Aftermarket phases.
The supergraph and federated subgraphs provide insights that span domains, allowing teams to anticipate how changes in one area might impact another, thus reducing costly rework and ensuring that decisions are made with a holistic understanding of the product.
Easy knowledge management & sharing
SPREAD simplifies knowledge management by centralizing all product-related information within a unified Digital Twin. Knowledge management is further enhanced by SPREAD’s Studio Share feature, which allows for secure, role-based access to data, making knowledge sharing effortless across teams and with external partners.
This setup provides engineers and other stakeholders with on-demand access to up-to-date insights, thereby enhancing collaboration and reducing the friction associated with sharing complex product information.
End-to-end collaboration
The PT fosters collaboration across all stages of product development and lifecycle management, providing tools for real-time updates, version control, and collaborative problem-solving. The unified view within SPREAD’s platform makes cross-functional alignment simpler and quicker, breaking down traditional barriers between teams.
Stakeholders across engineering, management, and production can track progress, identify bottlenecks, and align resources dynamically, ensuring projects move forward smoothly and with full visibility across all departments.
Enabling Artificial Intelligence
AI is embedded in the core of SPREAD’s PT, transforming how engineering data is interpreted and applied. With a network of Engineering Intelligence Agents, the platform offers predictive insights, automated analysis, and decision support that significantly reduce the manual effort engineers typically spend on data analysis and troubleshooting.
These AI agents bring advanced capabilities, such as similarity searches, automated change impact validation, and real-time performance monitoring, empowering engineers to make proactive decisions and focus more on innovation than routine tasks.
Conclusion: Discover Action Tower and bring future mobility closer, faster
SPREAD’s Action Tower transforms the development of mechatronic systems by eliminating data silos and taskforce-driven management. It gives CTO staff, R&D executives, series lead managers, and functionality leads the tools they need to reduce admin overhead, speed up development, and innovate with confidence. By integrating data from all relevant systems into a single source of truth, engineering teams can make faster, smarter decisions, bringing future mobility closer, faster.
Unlock your team’s potential to innovate and deliver the future of mobility already in the 21st century.
Learn more about know Action Tower